- Employers
- Advisors
ADVISORS
Roundstone recognizes and appreciates the important role benefits advisors play — that’s why we only operate through our network of trusted advisors.
- Resources
THE LATEST AND THE GREATEST
- Blog
BLOG
Stay up-to-date with the latest trends and learn about how small to midsize businesses can enjoy the benefits of self funded health insurance.
LATEST POST
FEATURED FAVORITES
- About Us
ABOUT US
We are a health benefits captive providing self-funded solutions to small and mid-sized employers. Our self-funded medical group captive bands employers together to fund their benefits the way much larger Fortune 500 companies do.
- Our TPA


TOPIC
How to Use PEPY as a Benchmark to Contain Healthcare Costs
- Roundstone Team
- 8 Minute Read
- Cost Containment
Find this article helpful? Share it with others.

Most employers can tell you exactly what they spend on payroll, rent, and equipment—but ask them to explain their healthcare costs, and they’re not so sure.
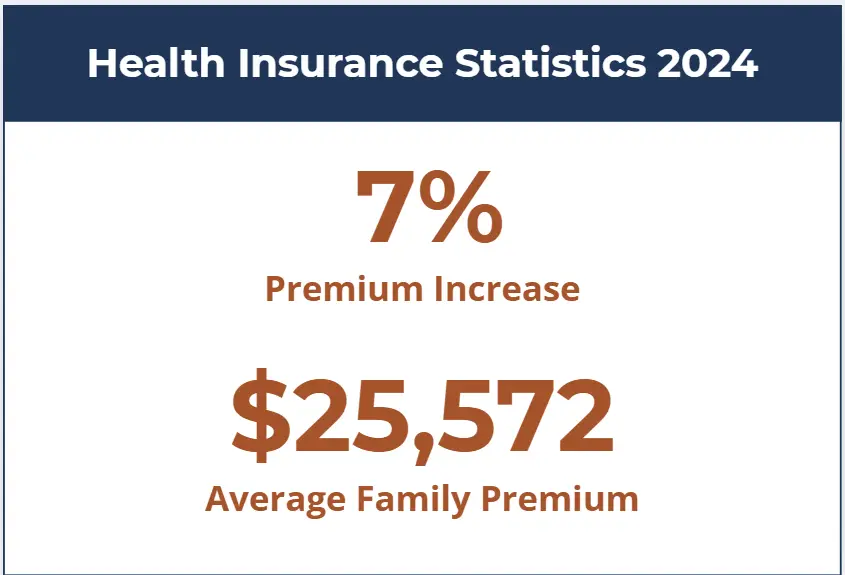
For many employers, healthcare is the second-highest expense after payroll—but unlike payroll, it often feels uncontrollable. And for good reason: In 2024, the average family premium for employer-sponsored healthcare rose 7% to $25,572, putting pressure on small and midsize businesses.
So how do you manage what you can’t see? You need transparency. And to measure progress, you need a benchmark. That benchmark is PEPY: per-employee-per-year cost.
Roundstone members who use data-driven PEPY analysis typically reduce healthcare spend by 8–15% in two years. This metric transforms cost containment from guesswork into measurable strategy and connects your efforts directly to results.
PEPY functions as your healthcare cost scorecard. Calculate it correctly, compare it to industry benchmarks, and track it quarterly, and you’ll know exactly where to focus cost containment strategies and whether those strategies deliver results.
Understanding PEPY transforms cost containment from guesswork into measurable strategy.
What Is PEPY and Why Does It Matter for Cost Containment?
PEPY represents the total annual cost of healthcare for each covered employee. Think of it as your cost-per-unit in healthcare spending.
PEPY functions as your healthcare cost scorecard. It enables you to:
Identify whether you're overpaying and by how much
Pinpoint which cost categories drive spending above benchmark
Measure the ROI of specific cost containment strategies
Set realistic reduction goals based on data rather than estimates
The 80/20 rule makes PEPY even more critical. A Medical Expenditure Panel Survey found that the top 1% of healthcare users account for approximately 22-24% of total expenditures, while the bottom 50% generate just 3% of costs.
Your PEPY helps you identify these patterns within your employee population and develop targeted interventions.
Join Our Newsletter
Sign up for fresh insights straight to your inbox.
How to Calculate Your PEPY
The calculation is straightforward:
Total Annual Healthcare Costs ÷ Number of Covered Employees = PEPY
Sample PEPY Calculation:
Total healthcare costs for the year: $250,000
Covered employees: 20
PEPY: $250,000 ÷ 20 = $12,500
Your total healthcare costs include:
Medical claims paid
Prescription drug costs
Stop-loss insurance premiums
Administrative fees
Third-party administrator (TPA) costs
Make sure you’re capturing all components for an accurate PEPY figure. Incomplete calculations give you incomplete insights.
Advisors: Learn more about how you can save your clients money with self-insurance through Roundstone’s group captive.
PEPY as Your Cost Containment Compass
Your PEPY number reveals whether you have a cost problem. Comparing it to benchmarks shows you how big that problem is. Claims data analysis tells you where to fix it.
Cost containment follows a continuous cycle:
Calculate baseline PEPY. Establish your starting point.
Compare to industry benchmarks. Identify the gap via Roundstone Reporting.
Analyze cost drivers in claims data. Discover what's causing the gap.
Implement targeted strategies. Address specific high-cost categories.
Track PEPY quarterly. Measure whether interventions work.
Our article What Is Cost Containment in Healthcare provides the comprehensive framework for this approach. PEPY serves as the measurement tool that makes the framework actionable.
Your PEPY number is important to know, but it doesn’t tell the whole story. Comparing it to industry benchmarks reveals whether you’re overpaying. Understanding why requires breaking down that PEPY into components.
With access to your claims data, you can see exactly where your healthcare dollars go.
Sample PEPY Component Breakdown
When one category drives your PEPY significantly above benchmark, you know exactly where to focus. If prescription drugs represent 35% of your PEPY compared to a 25% industry benchmark, your priority is to lower prescription costs through pharmacy cost management with a transparent pharmacy benefit manager (PBM).
Is your PEPY 15% above benchmark? Your claims data reveals whether it’s pharmacy costs, specialist visits, or chronic condition management driving the difference.
This precision transforms cost containment from generic advice into specific action plans tailored to your actual spending patterns.

CFOs: Download our CFO’s Guide to learn more about how to provide better benefits for less with Roundstone’s group captive.
Comparing Your PEPY to Industry Benchmarks
Industry benchmarks give context to your PEPY. A PEPY of $14,000 means nothing without knowing whether that’s above, below, or at the expected cost for similar companies.
Several factors influence appropriate benchmarks for your business:
Industry sector. Manufacturing, technology, and retail have different health risk profiles
Geographic location. Healthcare costs vary significantly by region.
Employee demographics. Age, gender distribution, and family coverage rates affect costs.
Company size. Larger groups may achieve better unit costs through risk pooling.
Roundstone’s captive provides benchmarking tools that account for these variables, giving you apples-to-apples comparisons rather than misleading national averages.
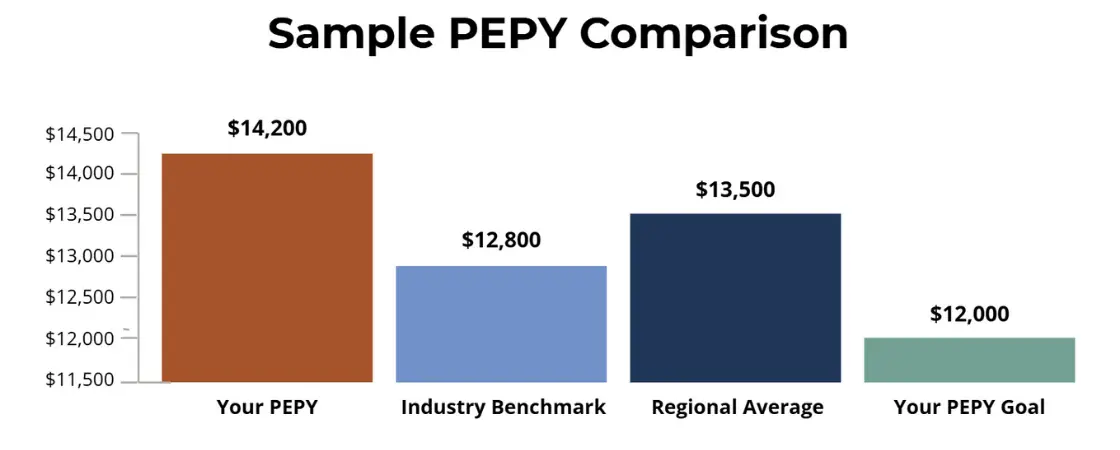
The gap between your PEPY of $14,200 and the relevant benchmark of $12,800 represents your opportunity. This $1,400 gap multiplied by 50 employees means $70,000 in potential annual savings through effective cost containment.
Strategies to Reduce PEPY Through Cost Containment
Once you’ve identified where your PEPY exceeds benchmarks, you can implement targeted strategies. The key is matching the strategy to the specific cost driver and measuring its impact on your PEPY.
Prescription Drug Cost Management
Brand-name prescription drugs accounted for 68% of drug spending in 2024. If your claims data shows pharmacy costs driving your PEPY above benchmark, this becomes your priority intervention.
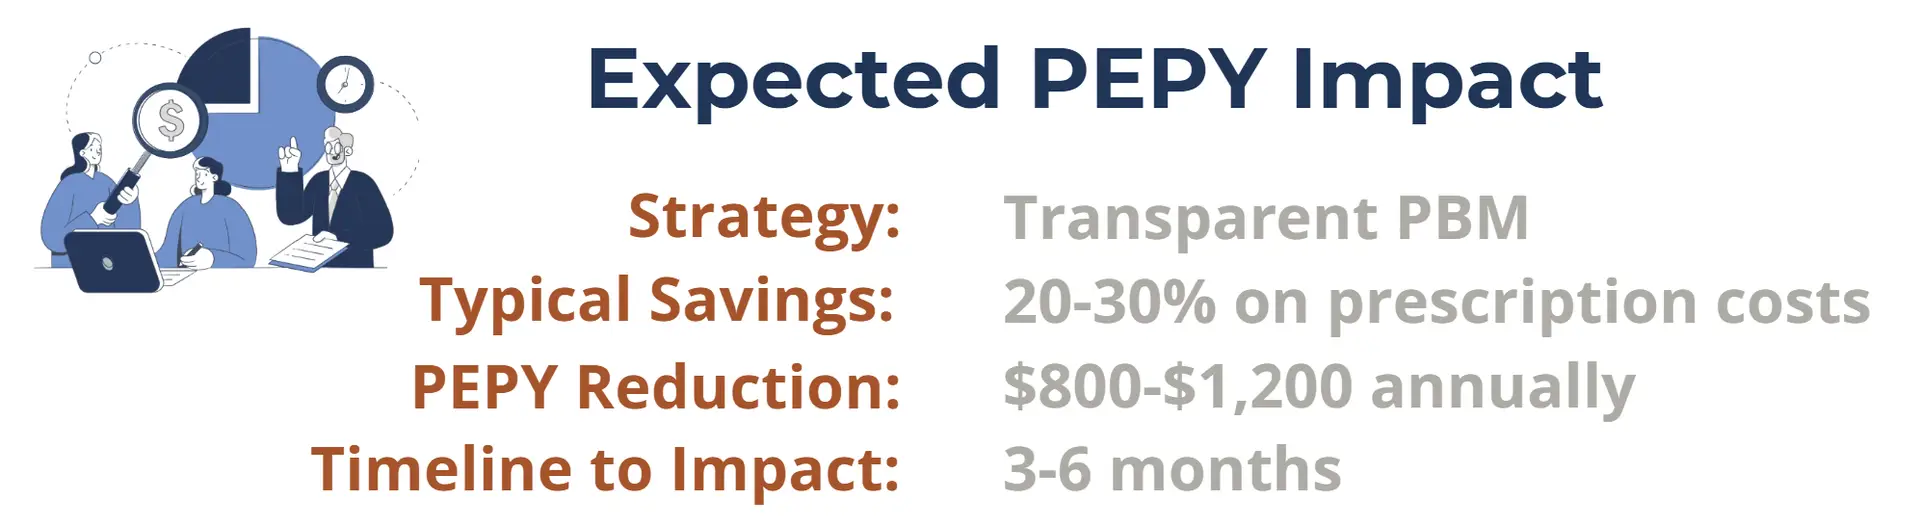
When you switch to a transparent pharmacy benefit manager), prescription costs typically drop by 20-30%. For a company spending $3,500 per employee annually on prescriptions, that translates to $700-$1,050 in PEPY reduction.
Traditional PBMs work for insurance carriers and keep negotiated savings for themselves. Pass-through PBMs operate on a transparent fee structure, passing all savings directly to you.
Read Pharmacy Benefit Managers: Your Key to Self-Funded Cost Containment to learn how this model works and the PEPY impact you can expect.
Track quarterly PEPY after implementing a transparent PBM to measure actual savings against projections.
High-Quality, Cost-Effective Provider Networks
With fully insured plans, your employees use whatever network the carrier provides. Self-funded plans through a group captive let you design networks around high-quality, cost-effective providers.
Centers of Excellence programs direct employees to high-performing facilities for major procedures, typically reducing costs by 20-40% while improving outcomes. Direct primary care programs increase access to primary care, reducing expensive specialist visits and emergency department usage.
These interventions lower your PEPY while improving employee health and satisfaction. The PEPY impact varies based on your current utilization patterns and the specific programs implemented.
Employee Well-Being Programs
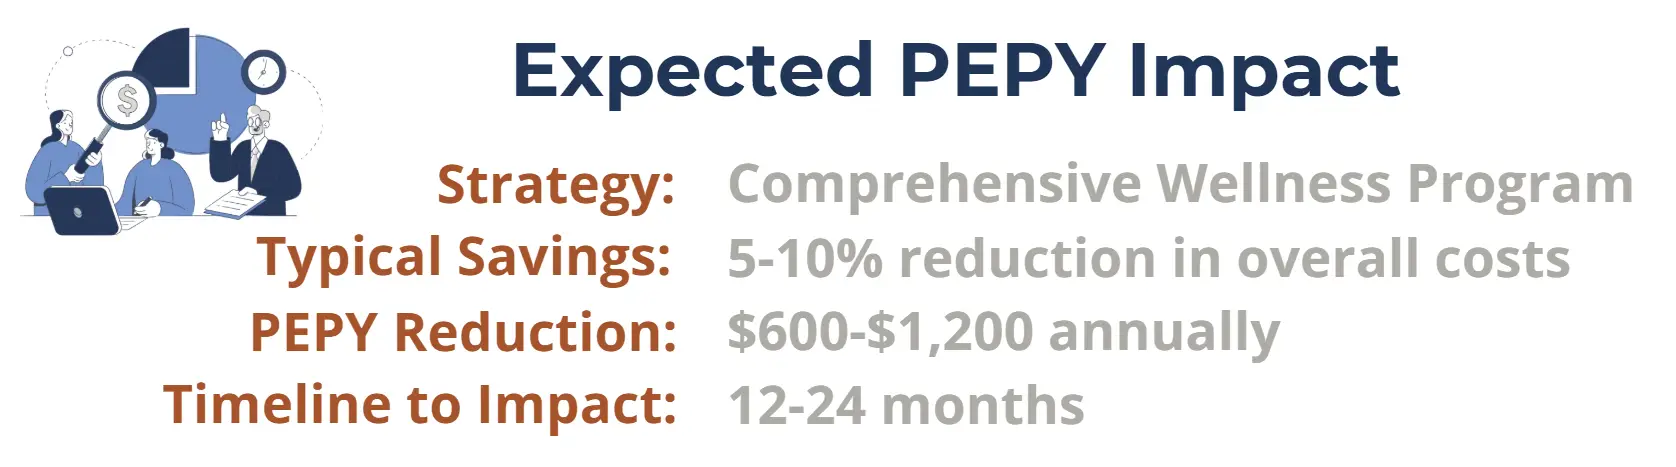
Well-being programs lower PEPY by improving employee health, particularly for the 20% of employees generating 80% of costs. Programs focusing on chronic condition management, preventive care, and lifestyle interventions reduce healthcare utilization over time.
The PEPY impact from wellness programs builds gradually. Expect modest first-year results with significant impact in years two and three as healthier behaviors reduce medical events.
Companies combining multiple strategies often achieve greater PEPY reduction than any single intervention. A transparent PBM plus targeted wellness programs plus improved network design can reduce PEPY by $2,000-$3,000 annually.
Tracking PEPY: Your Cost Containment Scorecard
PEPY isn’t a calculate-once metric. Effective cost containment requires tracking PEPY quarterly to measure whether your strategies deliver results.
Set a realistic PEPY reduction goal based on your benchmark gap and the strategies you’re implementing. Most Roundstone members reduce PEPY by 8-15% over two years through targeted cost containment.
That represents substantial savings. For example, a company with 40 employees and a starting PEPY of $14,000 can save $44,800-$84,000 annually at the end of two years.
This tracking reveals several important insights:
Cost containment strategies are working. PEPY dropped 15.5% over two years while industry benchmarks rose 7.8%. That's a 23.3 percentage point swing in your favor.
Savings compound. The company started $1,400 above benchmark ($56,000 annually) and finished $1,800 below benchmark. That swing represents $128,000 in annual cost difference.
Market conditions matter. Industry benchmarks typically rise 5-7% annually. If your PEPY stays flat, you're outperforming the market. If it drops, you're achieving significant savings.
Quarterly tracking also reveals whether individual strategies work. If you implement a new PBM in Q2, your Q3 and Q4 PEPY should reflect pharmacy savings. If they don’t, you can investigate and adjust.

Human Resources professionals: Learn how Roundstone supports captive administrators and makes switching easy. .
Is Your PEPY Competitively Priced?
Compare your current PEPY to industry benchmarks. If you’re at or above the benchmark, your plan isn’t competitively priced. You’re likely spending thousands of dollars annually that could be contained through data-driven strategies.
Roundstone has returned $91.8 million in unused premiums to members. This happens because lower PEPY means lower claims costs, and lower claims costs mean more surplus returned to you.
The connection between PEPY and surplus return is direct. Every dollar you reduce PEPY through legitimate cost containment goes back to your bottom line. In a group captive structure, you keep the savings rather than watching them disappear into an insurance carrier’s profit margin.
Without transparent access to claims data, you can’t calculate accurate PEPY, compare it meaningfully to benchmarks, or identify specific cost drivers. You’re managing healthcare costs blind.
Roundstone Reporting provides the data transparency you need. You can see every claim, analyze spending patterns, compare to benchmarks, and measure the impact of cost containment strategies.
Compare your current PEPY to industry benchmarks. If you’re at or above the benchmark, your plan isn’t competitively priced. You’re likely spending thousands of dollars annually that could be contained through data-driven strategies.
Why Roundstone?
Roundstone’s group captive provides the data transparency you need. You can see every claim, analyze spending patterns, compare to benchmarks, and measure the impact of cost containment strategies.
Our captive members achieve PEPY costs 24-34% below industry benchmarks. For a 50-employee company, that’s $121,000-$282,700 in annual savings. Two-thirds of members save enough in four years to fund their entire fifth year. We guarantee it.
Contact our team to learn how PEPY tracking as part of a self-funded group captive can guide your cost containment strategy. We believe in always aligning with the employers’ best interests and remain committed to our mission: quality, affordable healthcare and a better life for all.

Frequently Asked Questions About PEPY
Calculate quarterly to track trends and measure cost containment strategy effectiveness. Annual calculation misses opportunities for mid-year interventions.
Lower PEPY through cost containment strategies is good. Lower PEPY because you’ve reduced coverage or shifted costs to employees defeats the purpose. Focus on reducing wasteful spending while maintaining quality care.
Most employers using data-driven cost containment reduce PEPY by 8-15% over two years. Aggressive goals risk employee satisfaction; conservative goals leave money on the table.
Lower PEPY means lower claims costs. In a group captive, lower claims mean more unused premiums returned to you. PEPY reduction directly increases your surplus return.
Yes. Track your PEPY trends, factor in planned cost containment strategies and industry benchmark increases, and project future costs with reasonable accuracy. This beats the traditional approach of adding 7-10% to last year’s costs. PEPY-based budgeting accounts for your actual utilization patterns and planned interventions.
ABOUT THE AUTHOR
Roundstone Team
Enjoy Reading?
Check out these similar posts.

How to Choose a Provider Network for a Self-Funded Plan

How to Compare PBMs: A Practical Evaluation Framework

Roundstone Insurance © 2025